National debt on the fast track to a quadrillion
January 28th, 2023
It’s Saturday morning again. Welcome back.
Do you use the word “quadrillion” often? It comes after “trillion” – million, billion, trillion…quadrillion.
The answer is probably no. But your grandkids will, according to the quants who built the University of Pennsylvania’s Penn Wharton Budget Model.
The widely-respected model predicts U.S. debt held by the public will eclipse $1 quadrillion in 2080, and reach $2.5 quadrillion by 2095 – and that’s the optimistic scenario.
Much of the spending driving that debt accumulation has already been promised. It’s baked into existing law – it will happen absent some affirmative change.
This reality is often unseen in media reports. But the federal government’s unfunded liabilities present a much more realistic – and gloomy – picture of America’s debt crisis.
***
The headline figure for the national debt is about $31.5 trillion, which TRC Nexus discussed two weeks ago.
But what headlines and media stories don’t reveal is that the total value of U.S. government promises far, far exceeds $31.5 trillion.
The present value of America’s true “debt” totals something like $245 trillion, according to the Penn Wharton Model.
That’s an eye-popping, hard-to-believe figure. But some basic math shows it to be a realistic measure.
Penn Wharton arrived at its figure – called the “fiscal imbalance” – by measuring the projected cost of fulfilling all of the government’s future promises (including Medicare and Social Security) against the revenue that will be collected to fund them.
Most analyses impose an arbitrary cutoff year, but that colors the projection by including an entire generation’s worth of collected revenue while excluding the Social Security and Medicare payouts that generation will receive when it retires.
“Infinite horizon” analyses are more robust because they don’t impose a cutoff year, and that’s what Penn Wharton performed. The model assumed current entitlement programs, tax policy, and spending policy would continue unchanged, but that the temporary tax cuts passed in 2017 would expire as planned.
The $245 trillion fiscal imbalance represents 10.2% of allfuture GDP. What’s driving the imbalance? Medicare and Social Security account for nearly half of it ($106.6 trillion). Other government expenditures, including defense spending, make up the rest.
Eliminating the imbalance, according to Penn Wharton, would require a 52.7% increase in all future government revenue, a 35.6% decrease in all future government expenditures, or a combination of both (for reference, Social Security and Medicare accounted for 31% of federal spending in FY 2022).
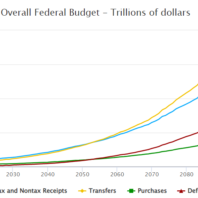
Put another way: Eliminating deficit spending in every government expenditure except Medicare and Social Security won’t come close to solving the problem. The below graph tells the story.

Source: Penn Wharton Model
The transfers (yellow) and purchases (green) represent the two categories of government expenditures. Transfers includes Social Security, Medicare, SNAP, and a few other programs; purchases includes everything else.
Without policy changes, transfer expenditures will grow at a far quicker pace than purchases. It is impossible to reach any semblance of balance without changes to transfers.
Unfortunately for those not yet born, past and current generations account for more than half of the Social Security and Medicare fiscal imbalance. That is to say, because past and current generations received more benefits from those programs than they paid in with taxes, future generations will have to both pay for their forefathers’ profligacy and bear the brunt of programs cuts if Social Security and Medicare (and the federal government) are to ever enjoy long-term solvency.
Even so, reform is simply a mathematical imperative. Changes to both revenue and benefits are likely required. Some of the most common proposals are:
- Increase the retirement age;
- Lower Social Security payouts, especially for higher-wealth retirees;
- Increase the income threshold above which Social Security taxes aren’t levied;
- Enact health marketplace reforms to lower the pace of cost-of-care increases.
As with most treatments, the earlier the better. The Penn Wharton Model’s predictions may be off around the margins, but the underlying trajectories are baked into existing law. By waiting, policymakers only guarantee more drastic measures will be required to achieve solvency.
The only alternative to reform, of course, is to do nothing and hope for the best.
Recent Articles
When Prayers are Heard, Answers Come: Finding Peace in Times of Crisis
From the Desk of Chuck Fuller “Our prayers, sir, were heard, and they were graciously answered” Many years ago, I led a task force responding to a series of tornados that devastated parts of eastern North Carolina. In our early discussions, we debated how many people needed to be impacted for us to implement a…
Read MorePassenger rail’s future in North Carolina
Thank you for joining us this Saturday morning. America once led the world in train travel. Routes spanned the continent and most people had easy access to a train station. But trains gave way to cars and planes, and by the 1960s privately owned train companies were bleeding revenue. In 1970, Congress passed and President Richard Nixon…
Read MoreThe Golden LEAF Foundation and North Carolina
Thank you for joining us this Saturday morning. Today we’re diving into one of the most impactful North Carolina organizations of the past 25 years: Goldean LEAF (“LEAF” stands for long-term economic advancement foundation)The nonprofit has largely flown under the radar for the past decade. That lack of public attention or controversy should be seen…
Read More
